HUMAN DEVELOPMENT INDICATORS (HDI) IN TAMILNADU
 |
| HDI in tamilnadu district wise |
Human Development Indicators in Tamilnadu and a Comparative Assessment across the country is one of the newly added and the most important topic in TNPSC exam. You can also download free pdf of the reference materials from the link given at the end of the article.
HDI is based on the following three indicators
- Life Expectancy Index
- Education Index
- GDP Per Capita
Dimension Index = (Actual value – Minimum value) / (Maximum value - Minimum value)
HUMAN DEVELOPMENT INDICATORS IN INDIA
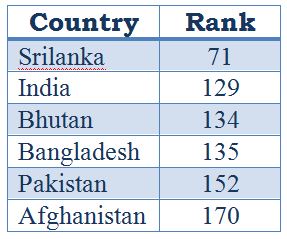
As per latest Human Development Report (2019) India has been ranked 129 out of 189 countries. India lies in Medium Human Development bracket with the HDI value of 0.647.
In 1990 India scored a HDI value of 0.431 and in 2019 it increased by 50%. Male HDI of India is 0.692 and Female HDI is 0.574.
Table 1: HDI value based Development assessment
Table 2: HDI ranking of India with its Neighbour countries
Table 3 : HDI ranking_Top 5 and Last Country
HUMAN DEVELOPMENT INDICATORS IN TAMILNADU
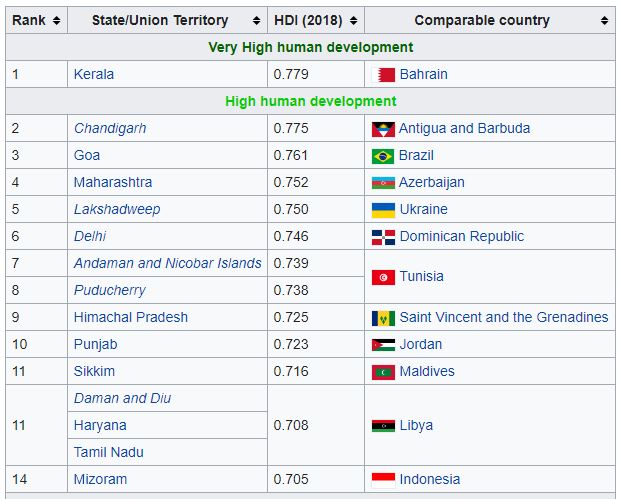
As per the UNDP report in 2018 the HDI value of Tamilnadu is 0.708 and it lies in the High human development bracket. HDI rank of Tamilnadu is 11 which includes Union territories. Among states Tamilnadu ranks 6th place.
1.A comparative assessment across the Country:
HDI value of Tamilnadu is similar to Haryana and the Union territory Diu and Daman. HDI of Libia is same as Tamilnadu.
Among the States Kerala tops the HDI ranking with the HDI value of 0.779 while Bihar is in the bottom with the HDI value 0.576. Among the Union territories Chandigarh tops the list and Dadra Nagar haveli is in the bottom.
Table 4 : HDI ranking of Indian states and UT
Human Development Indicators in Tamilnadu are listed below with district wise ranking,
(a) Human Development Index :
In HDI ranking Kanyakumari ranks first (0.944) and Ariyalur ranks last (0.282). Surprisingly Virudhunagar district came second in the list due to its relatively higher per capita income which is due to the spread of small scale industries such as printing and fireworks.
Gender Inequality Index measures the loss in potential of human development due to the inequality between female and male. GII was added in the UNDP report from 2010. In GII India ranks 122 with the GII value of 0.501. For measuring GII, three dimensions are considered, they are,
1. Reproductive health
2. Empowerment
3. Labour market
(c) Child Development Index:
The Child Development Index was developed by the “Save the Children” campaign in the United Kingdom (UK), in 2008. Three Indicators used for measuring CDI, they are
1. Health
2. Nutrition
3. Education
(d) Multidimensional Poverty Index :
The MPI is based on health, education and standard of living. MDPI was added in the UNDP report from 2010. In India 27.9% population (373,735 thousand people) are Multidimensionally poor.
(e) Food Security Index:
Food Security has three components—availability, accessibility and absorption.
(f) OTHER INDICATORS:
Per Capita Income: Kanyakumari came first in the list while Ariyalur ends the list.
Life Expectancy: Chennai tops the list while Tiruppur ends the list.
Literacy rate: Kanyakumari has high literacy rate while Dharmapuri has the low literacy rate.
Gross Enrollment ratio(GER) - Primary: Nilgiris came first while Tirupput came last.
Gross Enrollment ratio(GER) - Secondary: Surprisingly Dharmapuri came first in Secondary level GER and Erode came last.
MODIFICATION IN HDI
Biswajeet Guha has stated that the calculation of HDI neglected many important aspects of human development. He has created four indices of HDI as HDI 1, HDI 2, HDI 3, and HDI 4.
- HDI 1 is same as the HDI calculated by UNDP
- HDI 2 = HDI 1 + Quality of Life Index
- HDI 3 = HDI 2 + Poverty Alleviation Index
- HDI 4 = HDI 3 + Urbanization Index
Morris D Morris developed the Physical Quality of Life Index (PQLI) in 1970`s. The PQLI is a measure to calculate the quality of life (well being of a country). PQLI include three indicators such as
- Life expectancy
- Infant mortality rate
- Literacy rate.
A scale of each indicator ranges from the number 1 to 100. Number 1 represents the worst performance by any country and 100 is the best performance. For example, in case of life expectancy, the upper limit of 100 is achieved by Sweden with life expectancy of 77 years. The lower limit of 1 was achieved by Guinea-Bissau with life expectancy of 28 years.
The main difference between the two is the inclusion of income in HDI and exclusion of income from PQLI.
To download reference material for Human Development Indicators in Tamilnadu and a Comparative Assessment across the country ; Human Development Indicators in Tamilnadu : Click here
(HDI report and from School book)


No comments:
Post a Comment